

You can have thousands of visitors and still wonder why sales feel strangely quiet.
That is one of the most frustrating ecommerce problems. Your ads are running. Organic traffic is coming in. Your product pages look polished. Yet customers browse, click around, and disappear.
Analytics can tell you where the numbers drop.
Ecommerce heatmaps can help you understand what visitors were doing on the page before they dropped.
That distinction matters.
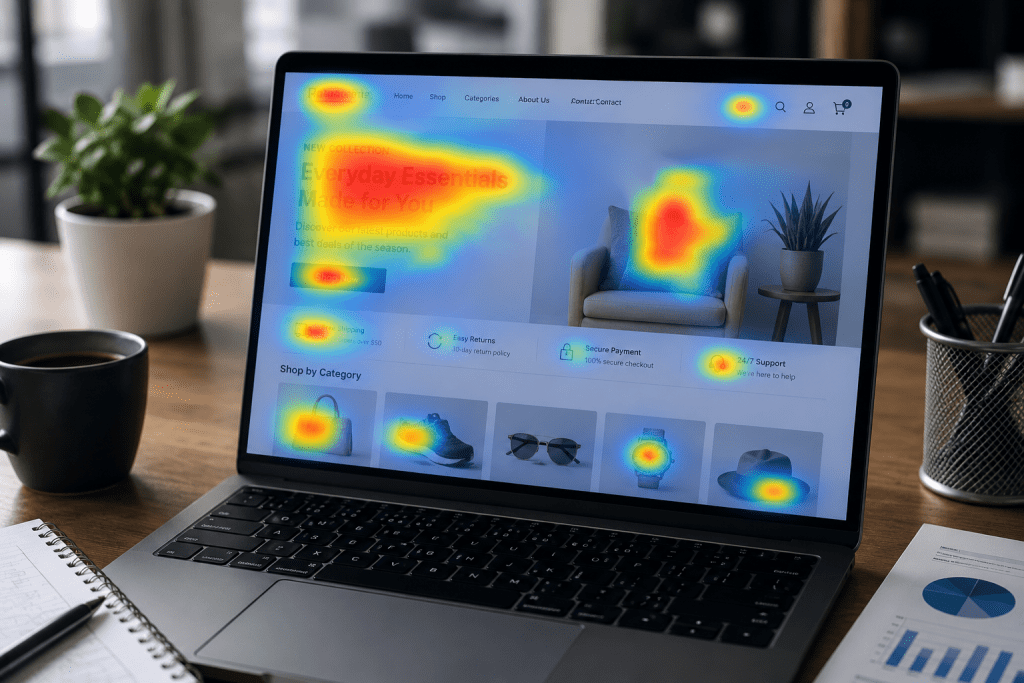
A heatmap visually represents interactions such as clicks, taps, scrolling, and movement. Depending on the platform, you can also investigate rage clicks, engagement areas, and individual session recordings.
For an ecommerce business, this turns vague suspicion into something you can investigate.
What Are Ecommerce Heatmaps?
An ecommerce heatmap is a visual layer placed over a webpage that shows patterns in visitor interaction.
Think of it as a behavioral map.
Instead of staring at a spreadsheet asking why customers are not clicking “Buy Now,” you can see whether they are clicking the button, ignoring it, or repeatedly clicking something else.
Common heatmap types include:
| Heatmap | What it helps you understand |
| Click maps | Where visitors click or tap |
| Scroll maps | How far visitors scroll |
| Move maps | Where desktop visitors move their cursor |
| Engagement maps | Which page areas receive interaction |
| Rage-click maps | Where repeated clicks may indicate friction |
Hotjar’s current documentation identifies click and tap, move, scroll, engagement, and rage-click heatmaps as distinct views.
The colors are not the insight.
The behavior is.
How Heatmaps Improve CRO
Suppose a product page receives 20,000 visits but generates surprisingly few purchases.
Your analytics might show a weak conversion rate.
A heatmap gives you another line of investigation.
You may discover that visitors spend considerable attention on product images but barely interact with the purchase area. Perhaps shoppers click a shipping message expecting more information. Maybe mobile users repeatedly tap an element that looks interactive but is not.
Those are UX clues.
Find clicks that should not exist
A visitor who repeatedly clicks a non-clickable element is telling you something.
They expected an action.
Your interface did not provide it.
Click maps can reveal these misleading interaction patterns and help you identify confusing page elements. Hotjar specifically notes that click and tap heatmaps can show whether visitors click intended links or mistakenly interact with non-interactive elements.
Find where attention disappears
A long product page is not automatically a better product page.
If shoppers consistently stop scrolling before they reach reviews, FAQs, shipping information, or your primary CTA, you have a placement problem worth investigating.
Scroll maps show the percentage of users reaching different parts of a page, giving you a clearer view of content visibility and engagement.
Sometimes the answer is not “write more.”
It is “move the important thing higher.”
Visitor Recordings Add the Missing Context
Heatmaps show patterns.
Recordings can show the sequence behind those patterns.
Microsoft Clarity describes session recordings as visual replays of user interactions, including clicks, taps, scrolls, and page visits. They can help teams understand what visitors were trying to accomplish, where they encountered problems, and how the experience unfolded.
This is where user behavior analytics becomes genuinely useful.
Suppose a heatmap shows repeated clicks around your size selector.
A recording might reveal the actual problem: customers open the selector, scroll through sizes, close it, reopen it, and eventually leave.
Now you have a hypothesis.
Maybe the size information is unclear.
Maybe the selector is awkward on mobile.
Maybe stock availability is confusing.
You can investigate the problem instead of redesigning the page based on someone’s personal preference.
Which Ecommerce Pages Should You Analyze?
Do not start with every URL on your website.
Start where commercial intent is highest.
Prioritize:
- Product pages
- Category and collection pages
- Cart pages
- Checkout-related screens
- High-traffic landing pages
- Paid campaign landing pages
- Pages with unusually high exits
- Pages with strong traffic but weak conversion
Your homepage may receive the most attention internally.
Your product pages may deserve more attention commercially.
That is an important difference.
A structured Website Audit can help connect behavioral findings with technical performance, content, mobile usability, navigation, and conversion barriers. Webiators also emphasizes auditing and continuous optimization as part of its broader ecommerce growth approach.
What Do Heatmaps Actually Show?
Heatmaps show interaction patterns.
They do not automatically explain customer intent.
That limitation is easy to overlook.
A bright area could mean something is useful. It could also mean visitors are confused and repeatedly interacting with it.
A cold area might indicate irrelevant content. Or it could simply sit below the point most visitors reach.
Context changes everything.
That is why I recommend combining heatmaps with:
- Conversion data
- Funnel analysis
- Device segmentation
- Customer feedback
- Session recordings
- Usability testing
- A/B testing
The strongest CRO workflow is not “find red area, change red area.”
It is:
Observe → form a hypothesis → make a change → test → measure → learn.
That is how UX optimization becomes a business process instead of a design exercise.
Which Heatmap Tool Is Best?
There is no single heatmap tool that is automatically best for every ecommerce business.
Microsoft Clarity provides heatmaps and session recordings, while Hotjar offers multiple heatmap views and behavioral analysis features.
Your decision should depend on the questions you need answered.
Consider:
- Heatmap types available
- Session recording capabilities
- Filtering and segmentation
- Device analysis
- Data retention
- Privacy requirements
- Integrations
- Reporting needs
- Budget
The tool is only part of the equation.
A sophisticated platform sitting unused is worth less than a simple tool connected to a disciplined CRO process.
Are Ecommerce Heatmaps Worth Using?
Yes, when you use them to investigate real business problems.
They are particularly useful when:
- Traffic is healthy but sales are weak
- Product pages receive attention but few add-to-carts
- Mobile conversion trails desktop
- Customers abandon important pages
- Visitors repeatedly interact with unexpected elements
- A redesign needs behavioral validation
- You want evidence before running an A/B test
Webiators’ current CRO approach similarly focuses on user behavior analysis, testing, landing page optimization, and continuous improvement rather than treating conversion optimization as a one-time redesign.
For a Shopify store, heatmap findings can inform Shopify CRO decisions around product pages, navigation, mobile UX, and checkout.
For Magento merchants, the same behavioral evidence can guide Magento CRO work across complex catalogs and buying journeys.
The platform changes.
The customer does not.
Turn Heatmap Data Into Revenue Decisions
Here is a simple example.
Observation: Visitors click product images repeatedly.
Possible issue: The gallery does not behave as expected.
Hypothesis: Shoppers want a larger product view.
Change: Improve image interaction and gallery controls.
Test: Compare engagement and conversion performance after the change.
That is a useful CRO loop.
Now consider another scenario.
Your scroll map shows that most mobile visitors never reach customer reviews.
Do you immediately delete the content above them?
No.
First, ask why.
Maybe the product description is too long. Maybe shipping information takes up too much space. Maybe the page hierarchy is forcing shoppers through unnecessary content.
The heatmap identifies the where.
Your broader research helps uncover the why.
That is the part that can lead to better decisions.
Stop Guessing Why Customers Leave
More traffic will not automatically fix a weak buying experience.
If customers are already arriving at your store, the smarter question may be what happens after they arrive.
Where do they hesitate?
What do they click?
What do they ignore?
How far do they scroll?
What happens immediately before they leave?
Those questions turn ecommerce heatmaps from colorful screenshots into practical conversion research.
And when the evidence points to a deeper problem, professional CRO Services can help turn those findings into a structured testing and optimization roadmap.
Your customers are already telling you where the friction is.
You just need to know how to read it.
FAQs
A heatmap is a visual representation of visitor interactions on a webpage, such as clicks, taps, scrolling, movement, and engagement.
Heatmaps do not increase conversions by themselves. They can reveal UX and behavioral issues that, once addressed and tested, may improve conversion performance.
Start with high-traffic, high-intent pages such as product pages, category pages, landing pages, cart pages, and checkout-related experiences.
Review them periodically and after major redesigns, campaigns, UX changes, or unusual shifts in conversion behavior. Avoid making decisions from very small samples.
Analytics primarily quantifies behavior through metrics and events. Heatmaps visualize where visitors interact with a page, while recordings can provide additional context about individual sessions.
